← ALL CHARTS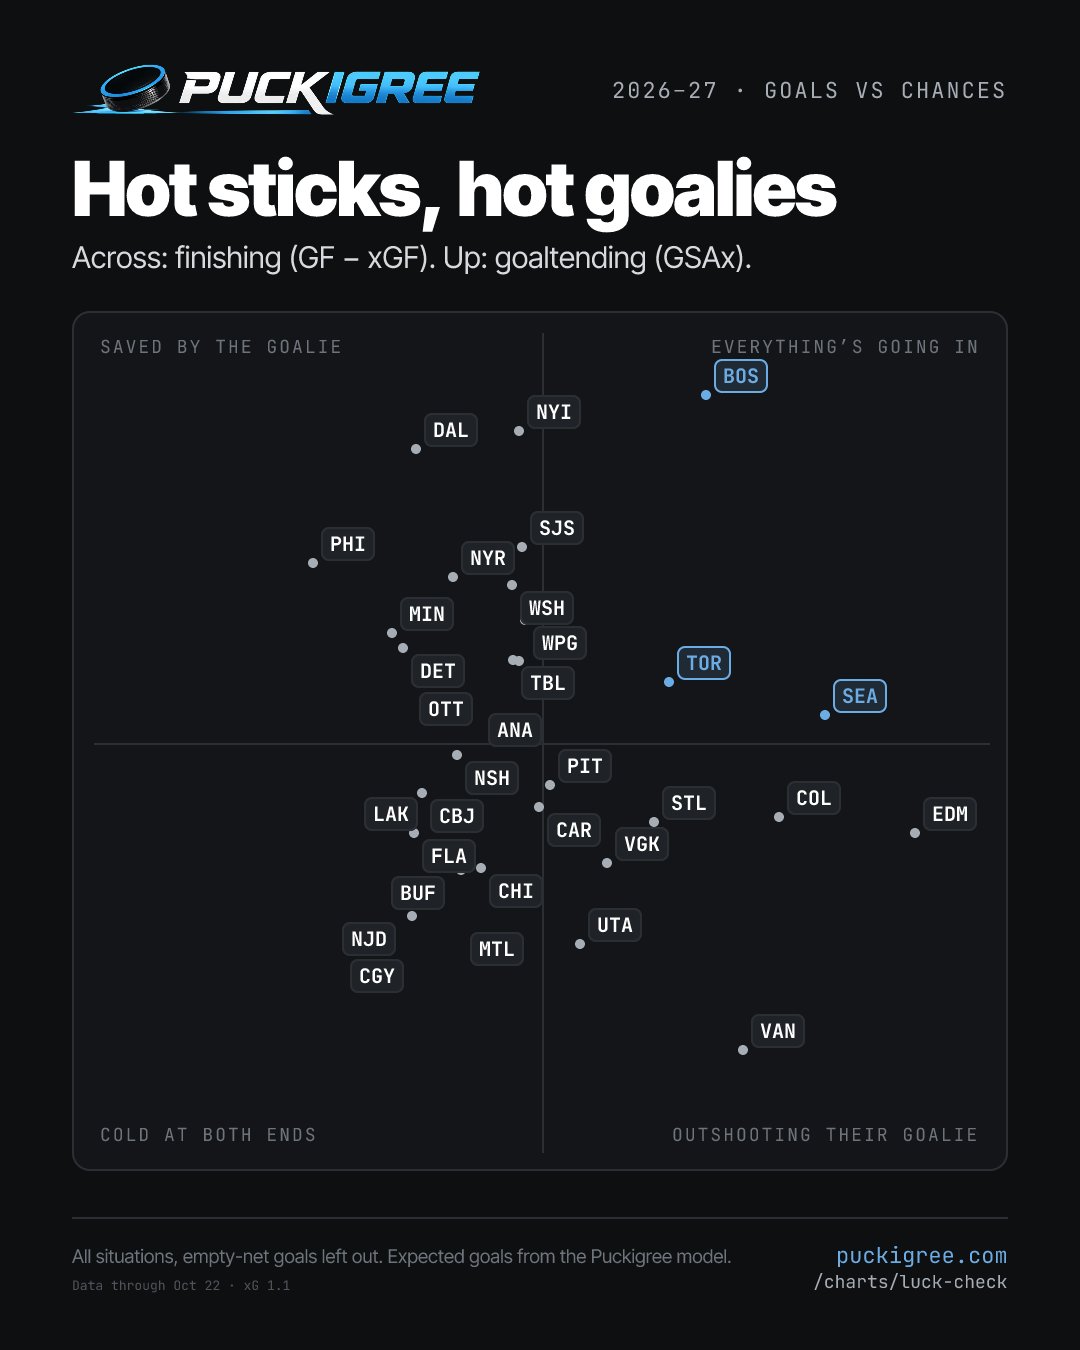
The numbers
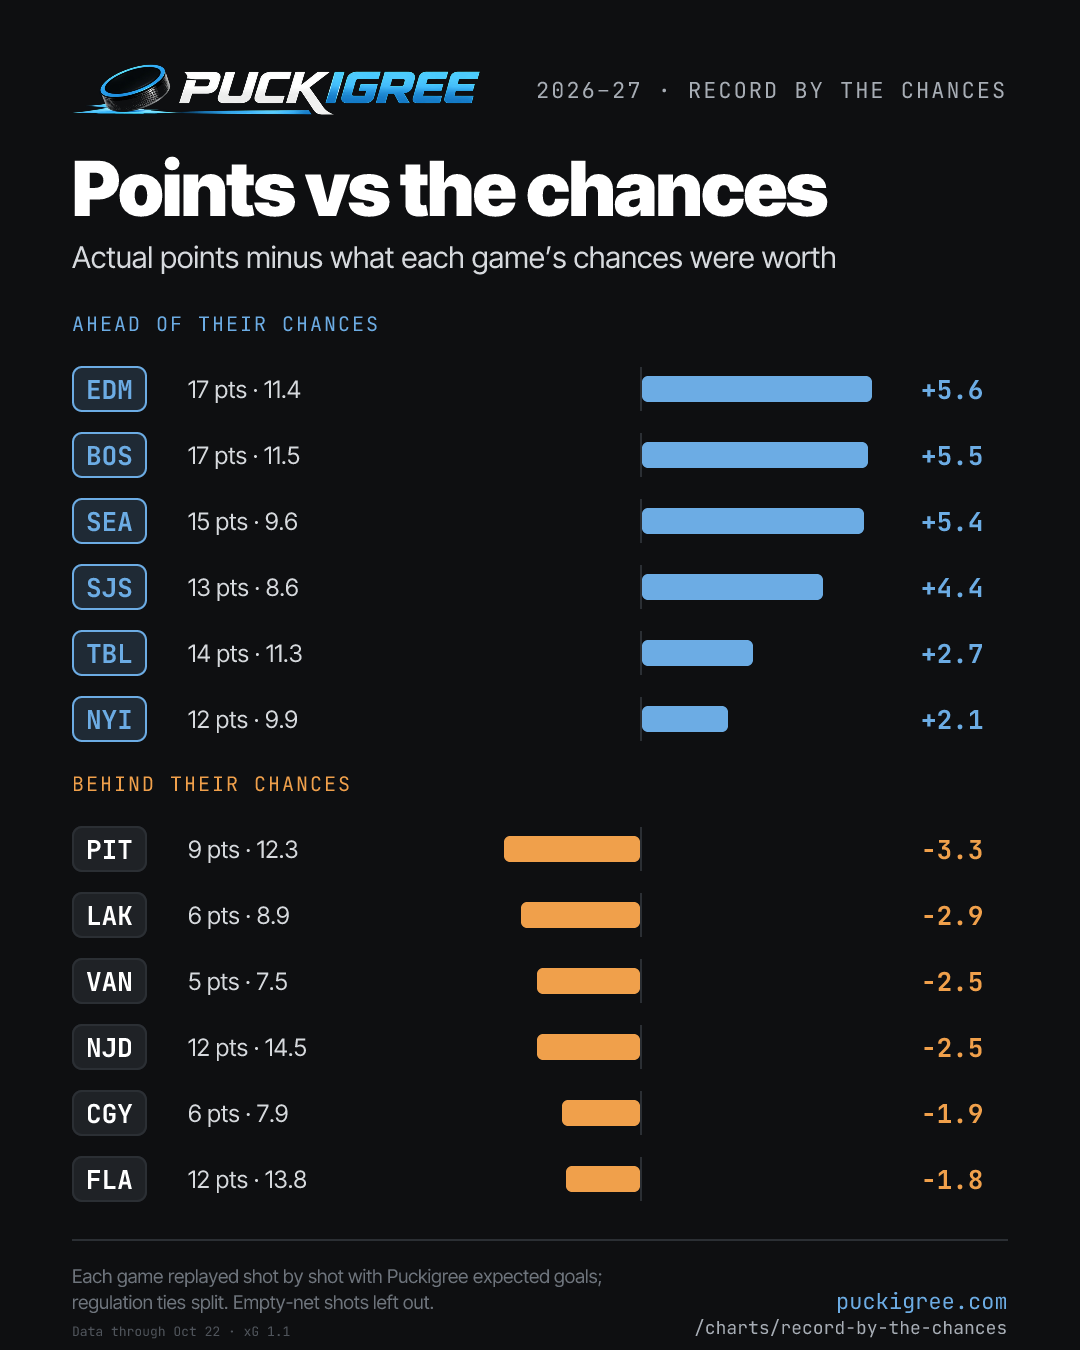
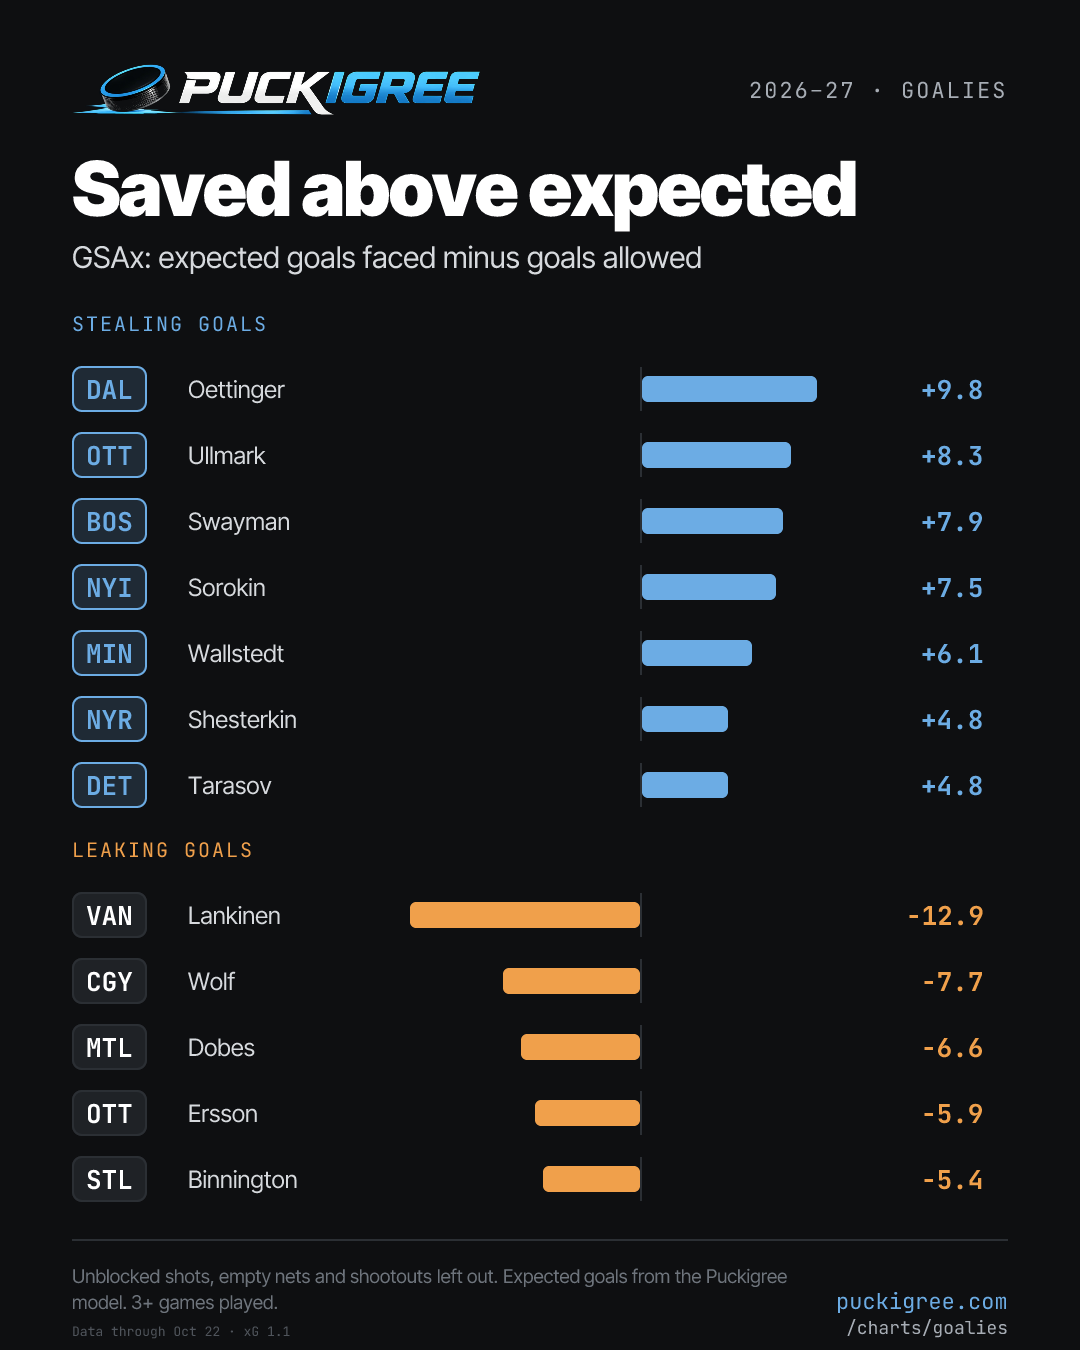
| Team | Finishing (GF−xGF) | Goaltending (GSAx) |
|---|---|---|
| Boston Bruins | +6.3 | +12.3 |
| Seattle Kraken | +10.9 | +1.0 |
| Edmonton Oilers | +14.3 | −3.2 |
| New York Islanders | −0.9 | +11.0 |
| Toronto Maple Leafs | +4.9 | +2.1 |
| Colorado Avalanche | +9.1 | −2.6 |
| San Jose Sharks | −0.8 | +6.9 |
| Dallas Stars | −4.8 | +10.4 |
| Washington Capitals | −1.2 | +5.6 |
| Winnipeg Jets | −0.7 | +4.3 |
| New York Rangers | −3.4 | +5.8 |
| Anaheim Ducks | −0.9 | +2.9 |
| Tampa Bay Lightning | −1.1 | +2.9 |
| St. Louis Blues | +4.3 | −2.8 |
| Ottawa Senators | −3.5 | +2.4 |
| Pittsburgh Penguins | +0.3 | −1.5 |
| Vegas Golden Knights | +2.5 | −4.3 |
| Minnesota Wild | −5.8 | +3.9 |
| Detroit Red Wings | −5.4 | +3.4 |
| Carolina Hurricanes | −0.1 | −2.3 |
| Philadelphia Flyers | −8.8 | +6.4 |
| Vancouver Canucks | +7.7 | −10.9 |
| Nashville Predators | −3.3 | −0.4 |
| Utah Mammoth | +1.5 | −7.1 |
| Columbus Blue Jackets | −4.6 | −1.8 |
| Montréal Canadiens | −1.6 | −4.9 |
| Chicago Blackhawks | −2.4 | −4.4 |
| Buffalo Sabres | −3.1 | −4.5 |
| Los Angeles Kings | −4.2 | −3.7 |
| Florida Panthers | −4.9 | −3.2 |
| New Jersey Devils | −5.0 | −6.1 |
| Calgary Flames | −6.2 | −7.2 |